

How to use Windows Performance Monitor logs
Applies to
- Microsoft Windows Operating System
Abstract
Determining the cause of system failures especially application crashes can be difficult to pinpoint. Using the Windows Administrative snap-in Performance utility, it is possible to create a graphical representation of the state of the system at a given period of time. The resulting files can be provided to your support provider for analysis.
Procedure
1. Open the Performance snap-in using one of two methods:
- from the Run line: Start > Run… : type in “Perfmon“, or
- from the Control Panel: Start > Control Panel > Administrative Tools > Performance
Next, expand the Performance Logs and Alerts section and select Counter Logs.
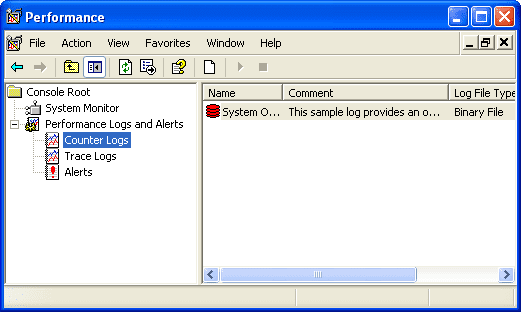
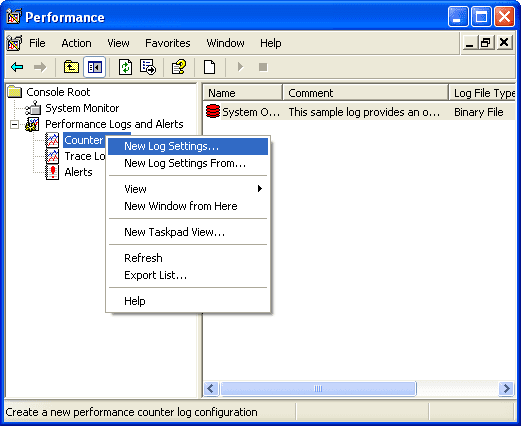
2. Right click Counter Logs and select New Log Settings…
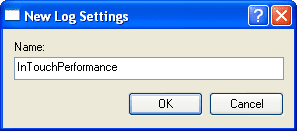
3. Give the log a useful name.
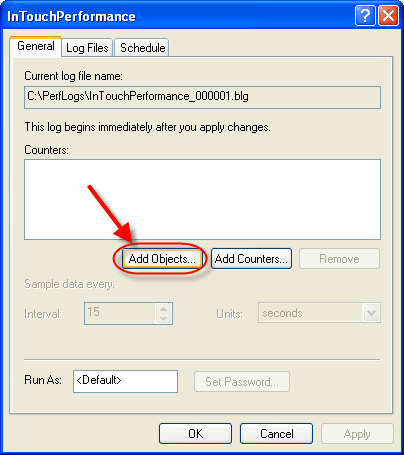
4. In the Log Settings screen, you will need to add Objects (collections of counters) or individual Counters. For this sample log choose Add Objects…
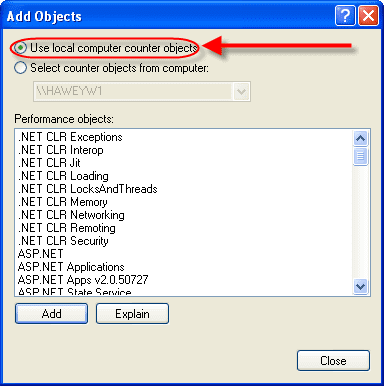
5. Make sure to select Use local computer counter objects. Then scroll down in the list to choose the following Objects to log:
- Memory
- Process
- Processor
- Thread
Click Close button when finished.
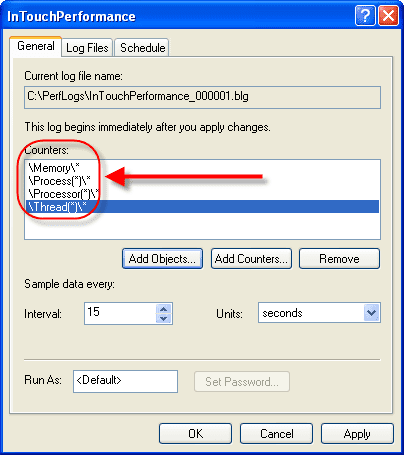
6. You should have the following Objects selected for your log. By default the log file will be saved in the C:\PerfLogs folder.
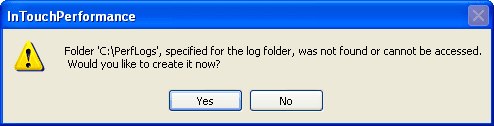
7. If you select OK, the system may generate an error if the C:\PerfLogs folder does not already exist. Select Yes to allow the system to create it.
Alternatively, you can select the specifics about the Log File format and location on the Log Files tab of the Log Properties screen.
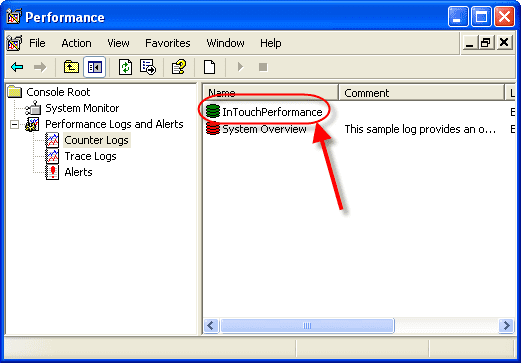
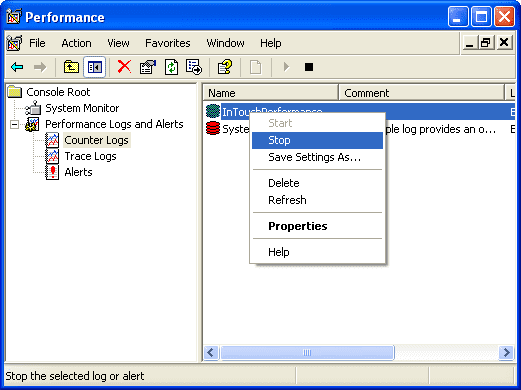
8. Once you select OK, the log will immediately start, and it’s icon will be displayed as green for active or red for inactive.
9. To stop the log from logging to the file, right click the counter log and select Stop.
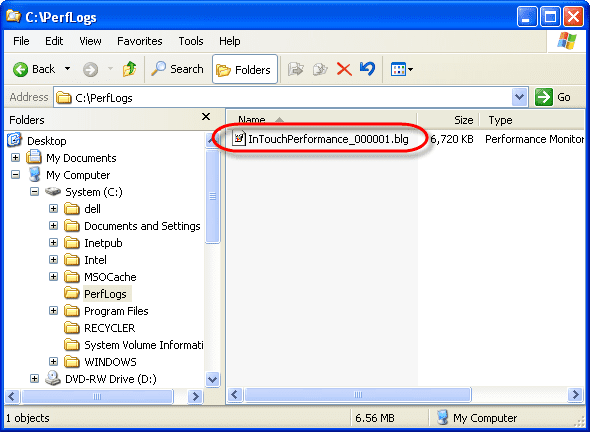
10. Next, locate the log file and send the resulting .blg file to support provider.
Note:
The above steps can result in very large log files due to the number of counters contained in the four Objects selected. This should be closely monitored to ensure that the log files are not growing at too high a rate to compromise the hard drive’s available space. Ideally, this would run until the target problem behavior occurs (i.e. application crash) at which time the logs can be retrieved and sent to support.
All Industrial Software Solutions Tech Notes are provided "as is" without warranty of any kind.