

How to monitor Wonderware Historian performance from Wonderware Industrial Application Server
SUMMARY
The AVEVA Historian includes two features that allow performance statistics to be collected and distributed to network clients. The System Driver module performs the task of collecting Historian performance statistics and the Historian IO Server allows clients to connect via Suitelink to acquire real-time data. Using these two features we can acquire Historian performance statistics to clients such as AVEVA Application Server for real-time monitoring and alarming.
APPLIES TO:
- Historian Server
- Application Server
Procedure
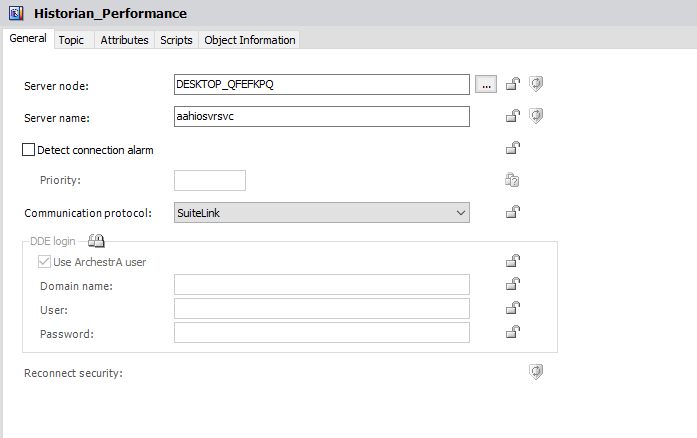
- First, we must know the node name or IP address of our historian. In this example, our historian is called ‘DESKTOP_QFEFKPQ’. With this information we can now configure a $DDESuitlinkClient DI (device integration) object to reference this data source.
- From the Application Server’s IDE (Integrated Development Environment), create a new $DDESuitelinkClient DI object by right-clicking on the $DDESuitelinkClient template in the template toolbox under the Device Integration Folder.
- Select New -> Instance. Then drag this object from the ‘Unassigned Host‘ and place it on an appropriate AppEngine. In this example we will rename this object to ‘Historian_Performance‘ (right-click on the object and select Rename).
- Double-click this object to open its configuration. Configure the object as shown in the screen-shots below:
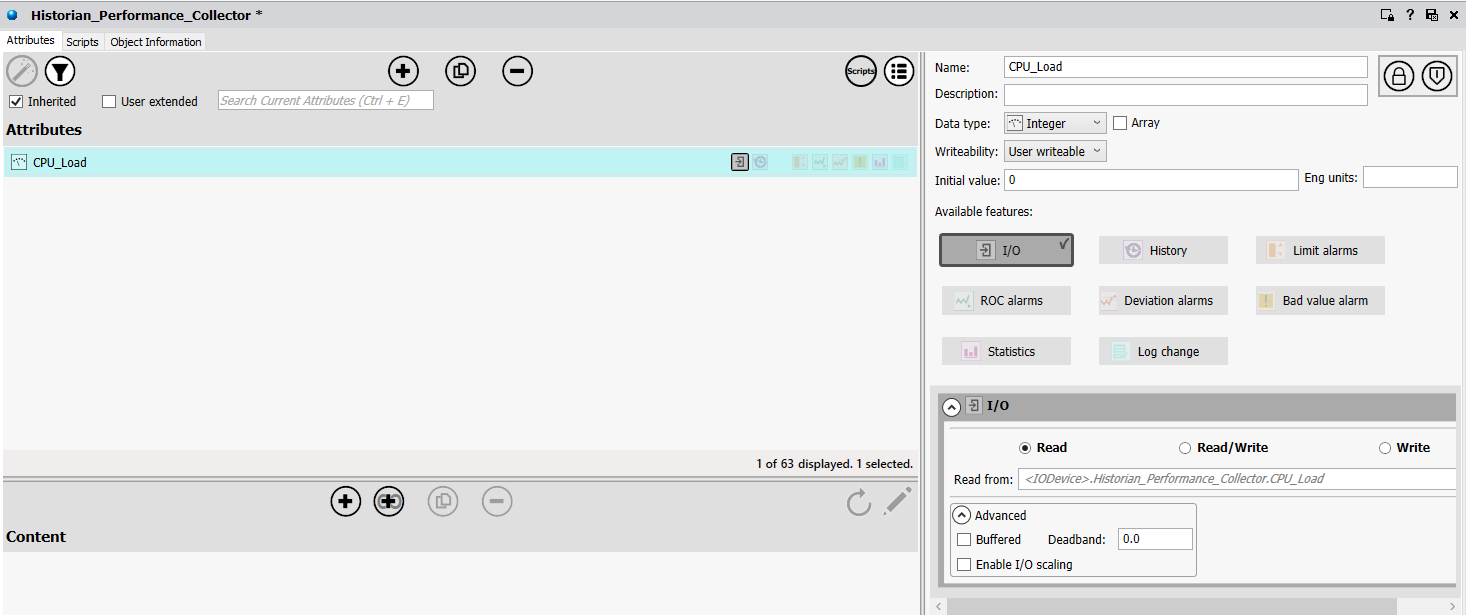
- Once we have configured a $DDESuitelinkClient DI object to reference data from the Historian, we can now configure another object to monitor and alarm on specific performance statistics. In this example we will be monitoring the Historian for CPU Utilization which indicate real-time processor load. To do this, create a new instance of the $UserDefined object and assign to the appropriate area. In this example we will call this object “Historian_Performance_Collector” Save and check in the object:
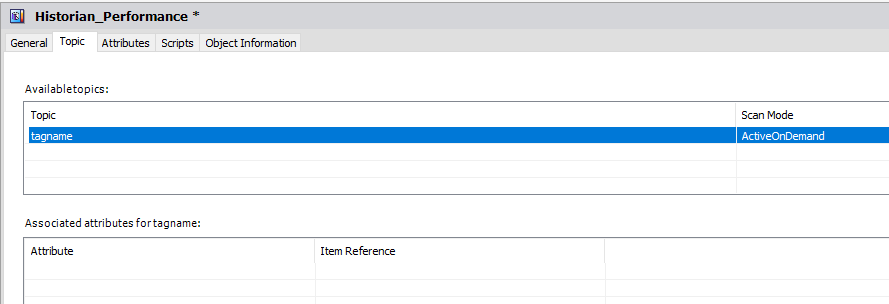
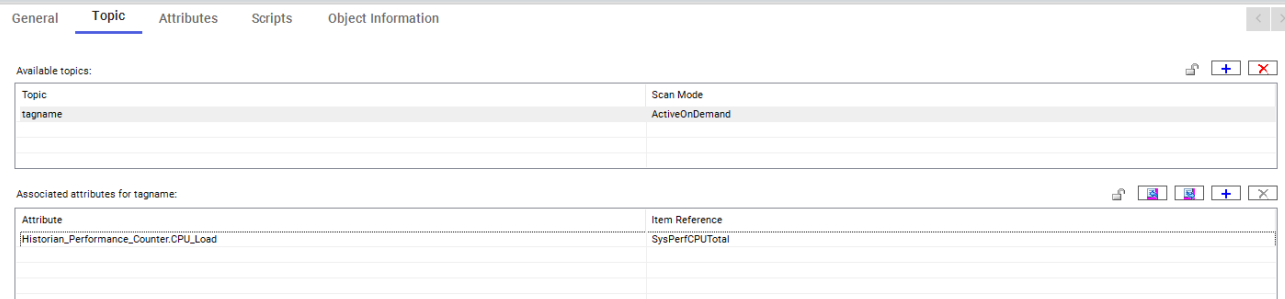
- Switch back to the DDESuiteLinkClient instance we previously created and configure an alias for each Historian Tag to be monitored, using only the appropriate Historian Server tagname. For example, Historian_Performance_Collector.CPU_Load references the SysPerfCPUTotal Historian system tag. Save and check in the object:
- Last step here is to deploy both objects that we have created. Deploy them both, and then check Object Viewer to confirm that data is being collected from the Historian:
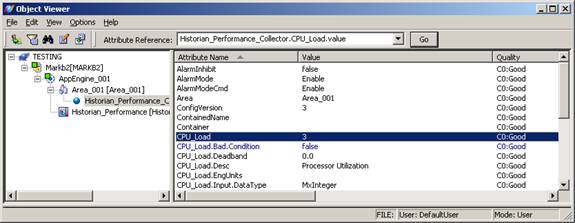
This object attribute can now be used within the galaxy to monitor the CPU utilization of the historian.
8. Below are some other important performance monitoring items that are available in InSQL. A complete list of InSQL performance tags can be located in the InSQL Books Online under the topic ‘System Tags‘.
Error Count Tags
- SysCritErrCnt – number of critical errors
- SysErrErrCnt – number of non-fatal errors
Storage Space Tags
- SysSpaceMain – space left in the circular storage path
- SysSpaceAlt – space left in the alternate storage path
I/O Statistics Tags
- SysPerfDataAcq<N>CPU – CPU load for the specific IDAS denoted by <N>
- SysPerfRetrievalCPU – CPU load for the client retrieval subsystem
- SysPerfStorageCPU –“ CPU load for the storage subsystem
All Industrial Software Solutions Tech Notes are provided "as is" without warranty of any kind.