

Tech Note 14: Creating batch reports with no predetermined time span using ActiveFactory Industrial Workbook
Applies to
- Wonderware IndustrialSQL Server/Historian 8.0 or 9.0 with all service packs and patches
- Wonderware ActiveFactory 9.1 with all patches and higher
Prerequisites
- Familiarity with Wonderware ActiveFactory, specifically IndustrialWorkbook
Introduction
This Tech Note describes the process of creating batch reports using IndustrialWorkbook Excel add-in (a part of ActiveFactory tool set). Batch reports don’t have determined time span. Time span needs to be determined based on a condition:
Retrieve time range when BatchNumber = actual batch number (if the batch number is an integer number) or BatchName = actual batch name (if the batch name is a string).
Therefore the way batch reports work is:
- In first step, the batch number is entered. Based on that parameter, batch start and batch end are returned.
- In the second step, the returned batch start and batch end times are used to query data for the overall batch report.
Our example is an Excel spreadsheet with 2 tabs:
- Reactor Report it will contain printable batch report with the actual data. It will also contain cell (in this example cell B4) in which the user will enter batch number for the report
- Report Parameters this tab will only contain internal report calculations
Description of batch reportA sample batch report will be created using 2 tags named ReactLevel and ReactTemp. The tags are included in an Wonderware InTouch’s demo application DemoApp1.
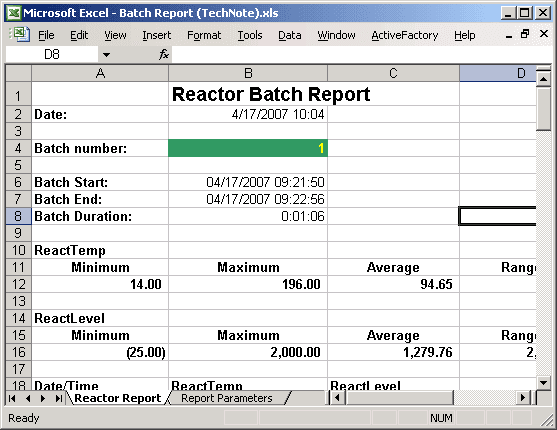
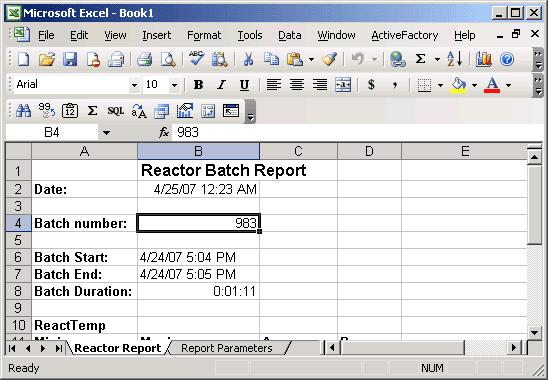
The report will contain the following elements:
- Report date and time (cell B2)
- Batch number or ID that the report is created for (cell B4) – this is the only field in the report that is going to be set by the user
- Batch start time (cell B6) and end time (cell B7) these two values will be retrieved from the IndustrialSQL Server database
- Batch duration (cell B8)
- Aggregated values for ReactTemp tag for the selected batch: minimum (cell A12), maximum (cell B12), average (cell C12), range (cell D12)
- Aggregated values for ReactLevel tag for the selected batch: minimum (cell A16), maximum (cell B16), average (cell C16), value (cell D16)
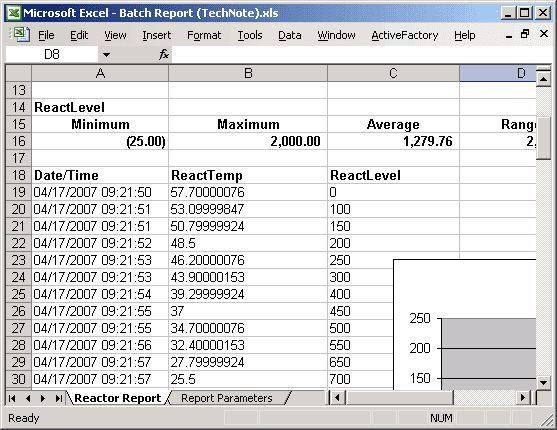
- History of values during the batch for ReactTemp and ReactLevel tags (cells A18:C18 and below)
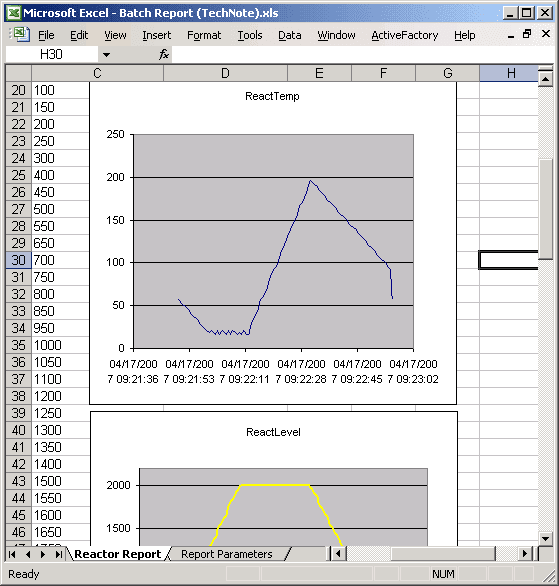
- Chart for ReactTemp and ReactLevel tags position next to the table of values
The internal Report Parameters tab will contain the following elements:
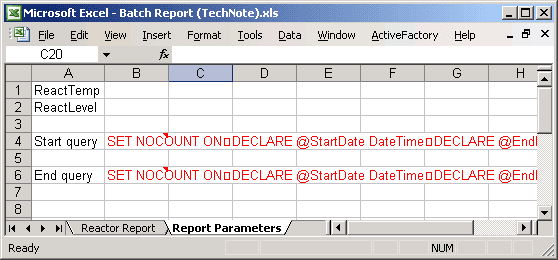
- names of tags to be included in the history of values table in this example they are ReactTemp and ReactLevel (cells A1 and A2)
- text of query that calculates batch start time based on the batch number (cell B4)
- text of query that calculates batch end time based on the batch number (cell B6)
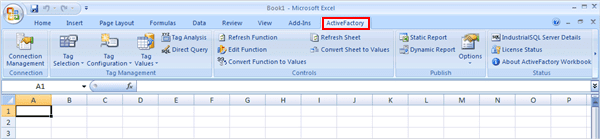
IndustrialWorkbook Excel add-inWhen using ActiveFactory 9.2 with Microsoft Office 2007, the IndustrialWorkbook add-in can be found under “Add-Ins” tab.
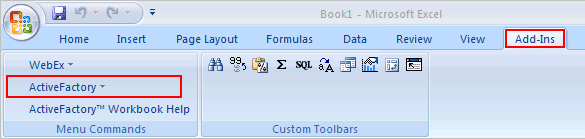
You can also enable ActiveFactory 9.2 to use the “ribbon bar” in Microsoft Excel 2007 and Word 2007. Wonderware PacWest Tech News
Procedure
Part 1: Look and feel of the report
1. On a system with ActiveFactory installed and configured against Wonderware IndustrialSQL Server 8.0 or 9.0, open Excel. This will create a new workbook.
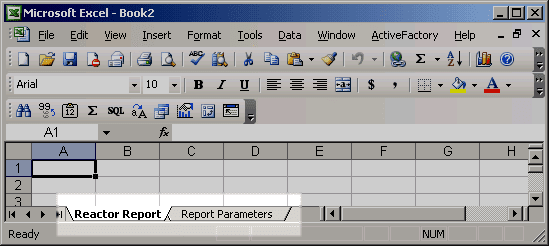
2. Rename the first tab, Sheet1 to Reactor Report, rename the second tab, Sheet2 to Report Parameters, delete the third tab (right click on Sheet3 tab and select Delete from the context menu)
3. On the Report Parameters tab, in cells A1:A2 type the names of tags that will be included into the report’s history of values per batch. Optionally, type in Start Query and End Query labels in respectively cells A4 and A6 (cells B4 and B6 will contain queries retrieving batch start and batch end)
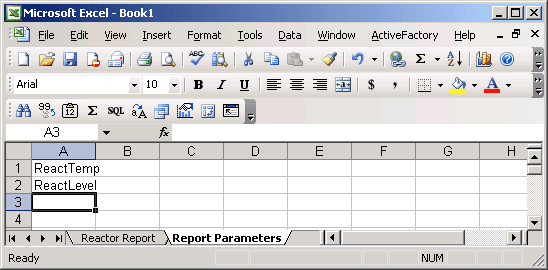
Note: you can include more than 2 tags in here (if you do so, keep adding tag names to the same column).
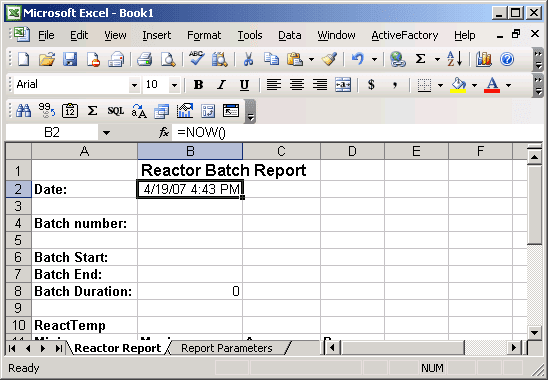
4. On the Reactor Report tab place report labels as shown on the screenshot below:
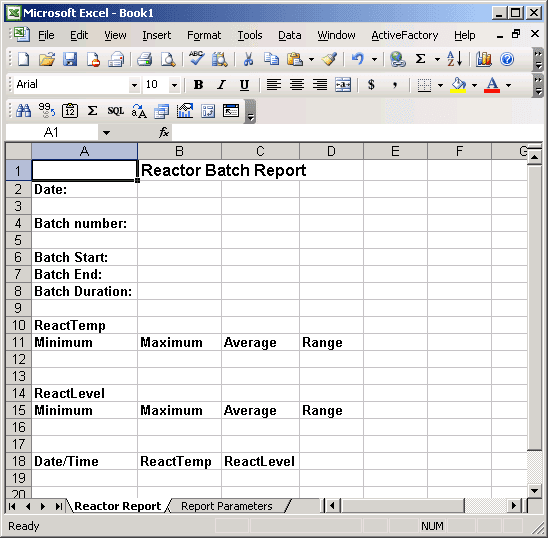
Note: all of the text elements above are plain text.
5. On the Reactor Report tab, type in the formula = NOW() in cell B2
6. Go to ActiveFactory menu -> Options -> Options and uncheck Display Heading box (since we’ve already typed in headings, we don’t need IndustrialWorkbook to enter them again).
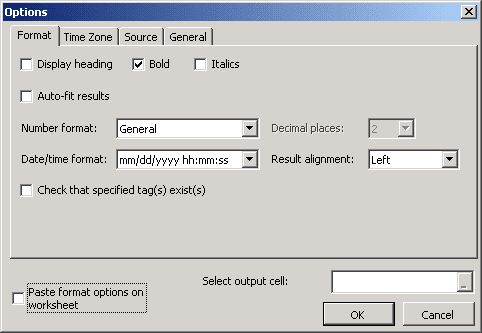
7. Click OK to close the dialog box.
Part 2: Configuring connection to IndustrialSQL Historian
1. Configure your connection to the IndustrialSQL Server by going to ActiveFactory menu -> Connection Management (refer to product documentation for detailed instructions). In this example server name is VMGIS9.
Part 3: Formula calculating batch start time
Download visual companion for Part 3 (Windows Media Video format, screen resolution 1024×768, length: 3 min 50 sec)
At this point we create a query using ActiveFactory Query that will return a single value representing time when our batch number tag became the value entered in cell B4 in the Reactor Report tab.
1. Select cell E4 in the Reactor Report tab – this cell will contain a formula that will get created using one of the Query Wizards in a moment. After we’ve created the formula we’re going to modify it to take into account the actual Batch Number entered by a user in cell B4.
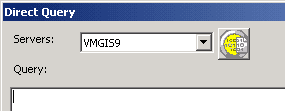
2. Select ActiveFactory menu -> Direct Query. The Direct Query window will appear on the screen.
3. Click the white-yellow icon (located next to the Servers drop-down list) to open ActiveFactory Query. ActiveFactory Query will appear on the screen.
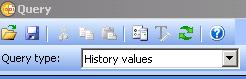
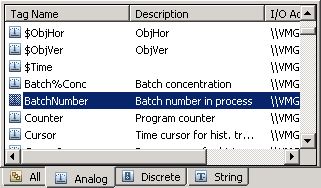
4. Under Query Type select History Values
5. Under Tags select the Tag that contains the batch number (in this example it’s BatchNumber)
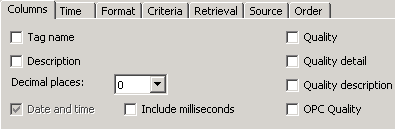
6. Clear all check boxes under Columns tab
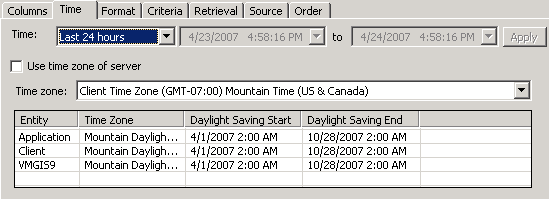
7. Under the Time tab select Last 24 hours this is going to be the time in which the query will try to find the start time of the batch number entered by the user in cell B4.
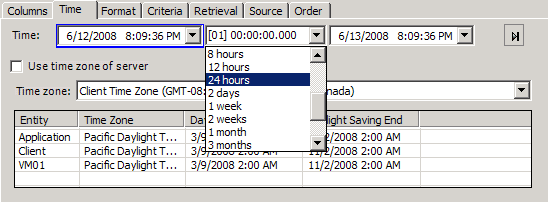
Select 24 hours when using Wonderware ActiveFactory 9.2
8. Leave Format tabs with default options (Narrow format).
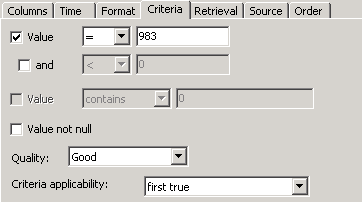
9. Under Criteria tab check Value, select ‘=’ (equal) operator and enter a sample batch number (983 in this example), select Quality as Good, and select Criteria Applicability as First True (we want to detect the very first moment of time when the batch number turned to the value in the query).
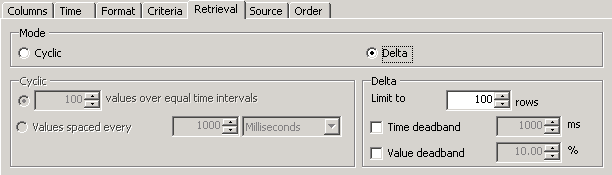
10. Under Retrieval select Delta mode.
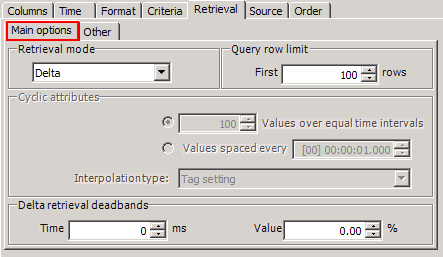
If using Wonderware ActiveFactory 9.2 go to Main options tab and select Delta mode
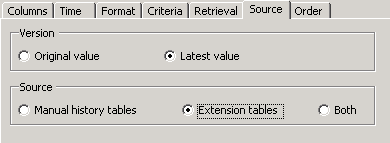
11. Under Source tab select Latest Value and Extension tables.
12. Leave Order tab with default values.
13. At this point Results pane should populate with results under the Data tab showing the very first moment of time when the Batch Number became the Value entered.
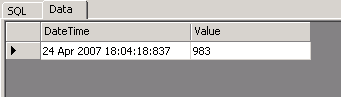
In ActiveFactory 9.2:
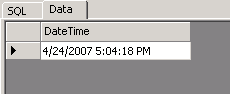
14. We want our query to return just the time (without the value). So at this point, we’re going to further manually tweak the query. To do that switch from Data tab to SQL tab in the lower right pane
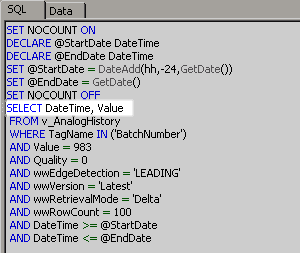
and carefully modify the query by removing the text “Value” from the SELECT portion of query text, so it should read like shown below:
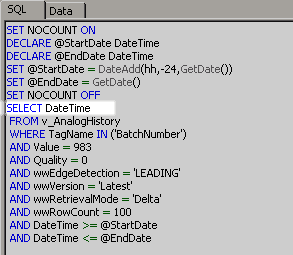
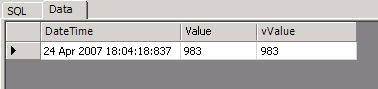
Click on the Data tab to confirm that the query returns only DateTime:
15. Click OK in the main Query window, this will cause the query text to be pasted back to Excel’s Direct Query dialog box. Then click OK again to close the Direct Query dialog and come back to Excel’s main screen. The query text will paste into cell E4 and the result is retrieved into cell E6 in the Reactor Report tab.
16. At this point, we will want to remove the query text from the Reactor Report tab and move it to the Report Parameters tab. In order to do that:
- right click on cell ‘Reactor Report’!E4 (the query text)
- cut it to clipboard using context menu’s Cut command item (make sure you cut and not copy the cell)
- switch to Report Parameters sheet and select cell B4
- paste clipboard contents into cell B4 on the Report Parameters tab
17. Switch back to the Reactor Report tab, select cell E6 (the result), cut it to clipboard and paste it into cell B6 (still in the Reactor Report tab).
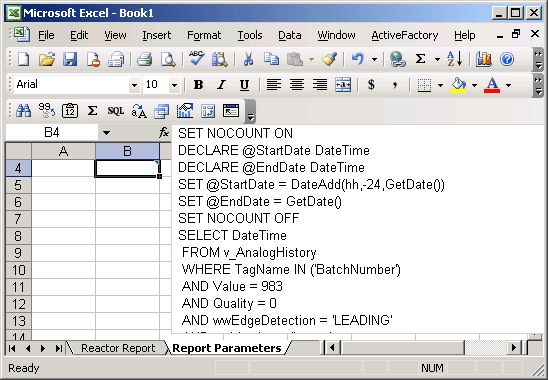
18. At this point we have a formula that finds batch start time for a fixed batch number (983 in this example). Our next step is to tie it dynamically to the batch number in cell B4 of the Reactor Report sheet. In order to do so change the formula located in the cell ‘Report Parameters’!B4 to look like this:
(changes to be made are indicated in red, the formula can be copied from the web page and pasted into cell B4)
=”SET NOCOUNT ON
DECLARE @StartDate DateTime
DECLARE @EndDate DateTime
SET @StartDate = DateAdd(hh,-24,GetDate())
SET @EndDate = GetDate()
SET NOCOUNT OFF
SELECT DateTime FROM v_AnalogHistory
WHERE TagName IN (‘BatchNumber’)
AND Value = ” & ‘Reactor Report’!$B$4 & “
AND Quality = 0
AND wwEdgeDetection = ‘LEADING’
AND wwVersion = ‘Latest’
AND wwRetrievalMode = ‘Delta’
AND wwRowCount = 100
AND DateTime >= @StartDate
AND DateTime <= @EndDate“
Note: The query may generate an error on the Reactor Report page in Batch Start cell (at B6) until you enter a batch number in the cell ‘Reactor Report’!B4.
Optional – query to calculate batch start time in case batch name is a string value
In the case of using string value for Batch Name our recommendation is to use 2 tags to manage batch start and end:
- a string type BatchName
- a discrete type tag that will indicate when actually the batch was processed (let’s call the tag ProcessRunning in this example)
In such situation we’d need to execute 2 queries:
- the first one will determine when the BatchName value changed
- the second one will determine when the process started running for the specified BatchName (ProcessRunning == 1)
So the first query could be executed internally within the Report Parameters tab and it could look 24 hours and locate the first time the tag “BatchName” equals the batch name provided by the user in the “Reactor Report” tab (marked in yellow are differences between the query above):
=”SET NOCOUNT ON
DECLARE @StartDate DateTime
DECLARE @EndDate DateTime
SET @StartDate = DateAdd(hh,-24,GetDate())
SET @EndDate = GetDate()
SET NOCOUNT OFF
SELECT DateTime FROM StringHistory
WHERE TagName IN (‘BatchName‘)
AND Value LIKE ‘” & ‘Reactor Report’!$B$4 & “‘
AND Quality = 0
AND wwEdgeDetection = ‘LEADING’
AND wwVersion = ‘Latest’
AND wwRetrievalMode = ‘Delta’
AND wwRowCount = 100
AND DateTime >= @StartDate
AND DateTime <= @EndDate“
Note the following changes above:
- table name changed to StringHistory
- LIKE operator (instead of = operator)
- different tag name queried (BatchName as opposed to BatchNumber)
The result of the query above could be placed in cell A5 in the Report Parameters tab.
The second query could use the time found from the 1st query (placed in ‘Report Parameters’!A5) and, from this start time, find the first time the tag ‘ProcessRunning’ is equal to the value 1:
=CONCATENATE(
“SET NOCOUNT ON
DECLARE @StartDate DateTime
DECLARE @EndDate DateTime “,
“SET @StartDate = ‘”, TEXT(A5,”yyyymmdd hh:mm:ss”),
“‘ SET @EndDate = GetDate()
SET NOCOUNT OFF
SELECT TOP 1 DateTime
FROM History
WHERE TagName IN (‘ProcessRunning’)
AND Value = 1
AND Quality = 0 “,
” AND wwRetrievalMode = ‘Delta’
AND wwVersion = ‘Latest’
AND wwEdgeDetection = ‘LEADING’
AND DateTime >= @StartDate
AND DateTime <= @EndDate”)
The query above uses Excel’s function called CONCATENATE to append dynamic portions of the query (such as TEXT(A5,”yyyymmdd hh:mm:ss”)) to static portions of the query. The end result of it (which is batch start time) should be included in the cell ‘Reactor Report’!B6.
Part 4: Formula calculating batch end time
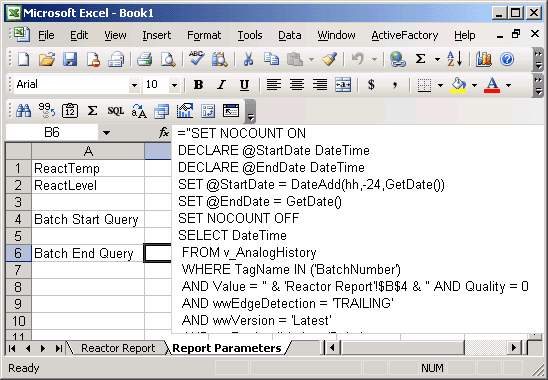
1. Copy the formula above from the cell ‘Report Parameters’!B4 to ‘Report Parameters’!B6,
then modify wwEdgeDetection = “LEADING” to read wwEdgeDetection = “TRAILING” – this will the query retrieve the batch end.
2. Switch to Reactor Report tab, copy the formula from the cell B6 (Batch Start) to clipboard and paste it into cell B7 (Batch End).
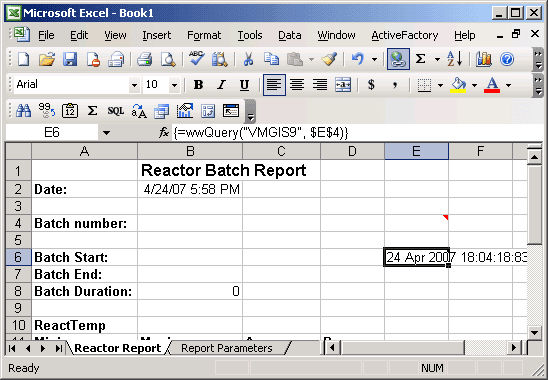
Then modify the formula to read =wwQuery(“VMGIS9”, ‘Report Parameters’!$B$6) replace VMGIS9 with the name of your IndustrialSQL Server.
3. Type in the formula =B7-B6 in the cell B8 in the Reactor Report tab (this will calculate batch duration). At this point you may see errors in cells B6, B7 and B8, to eliminate them enter a valid batch number into cell B4.
4. If needed change formatting of B6 and B7 cells to Date, B8 to Time Interval only (indicated in the Excel’s Format Cells -> Category: Time -> Type -> “37:30:55” – for further information check Excel’s documentation). After these change the spreadsheet should look like this:
Optional – query to calculate batch end time in case batch name is a string value
In the case of using string value for Batch Name our query will use the time we found in the previous step (testing ProcessRunning = 1) as the start time and will look for the time when ProcessRunning goes from 1 to 0.
=CONCATENATE(
“SET NOCOUNT ON
DECLARE @StartDate DateTime
DECLARE @EndDate DateTime “,
“SET @StartDate = ‘”, TEXT(‘Reactor Report’!B6,”yyyymmdd hh:mm:ss”),
“‘ SET @EndDate = GetDate()
SET NOCOUNT OFF
SELECT TOP 1 DateTime
FROM History
WHERE TagName IN (‘ProcessRunning’)
AND Value = 0
AND Quality = 0 “,
” AND wwRetrievalMode = ‘Delta’
AND wwVersion = ‘Latest’
AND wwEdgeDetection = ‘LEADING’
AND DateTime >= @StartDate
AND DateTime <= @EndDate”)
Part 5: Aggregation Formulas
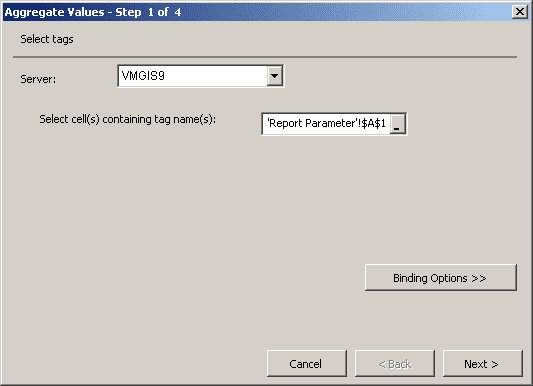
1. Select cell A12 and go to ActiveFactory menu -> Tag Values -> Aggregate Values. Aggregate Values wizard will appear on the screen.
2. In Step 1 of 4, select the cell that contains ReactTemp tagname (in our example it’s “Report Parameters”!$A$1) and hit Next.
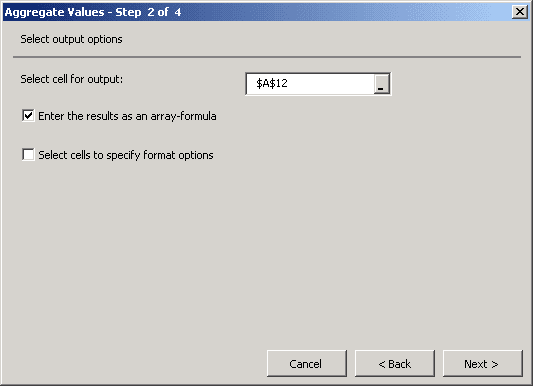
3. In Step 2 leave all default settings (Select cell for output should state $A$12)
4. In Step 3 under Calculations tab select Minimum, leave all other settings at this step with default values.
5. At Step 4, select Absolute time option, and select fields “Reactor Report”!$B$6 and “Reactor Report”!$B$7 for Start Time and End Time respectively (see the screenshot below for reference).
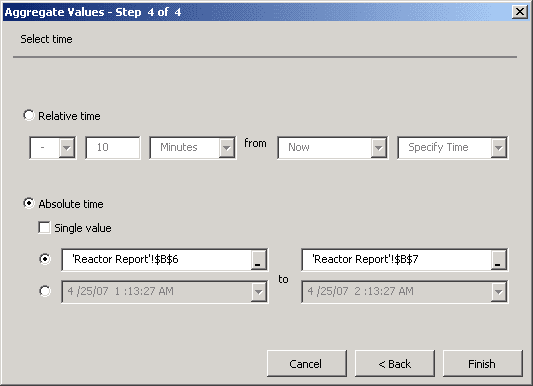
then click Finish.
6. As the minimum value of ReactTemp is pasted into cell A13 on Reactor Report tab, move the formula from A13 to cell A12 within the same tab.
7. Copy the formula from A12 to cell B12 then modify the copied formula to read
=wwAggregate(“VMGIS9″, ‘Report Parameters’!$A$1,”Row0″,’Reactor Report’!$B$6,’Reactor Report’!$B$7,”MAX“,””)
In other words change the text “MIN” to “MAX”.
8. Copy cell B12 to C12 and D12 and respectively change “MAX” to “AVG” and “RNG”
9. Select cells A12 through D12 and copy them to clipboard, then select cell A16 and paste clipboard contents in there.
10. Then modify each cell, A16 through D16 individually,
changing the following reference ‘Report Parameters’!$A$1 to ‘Report Parameters’!$A$2
11. After these steps the Reactor Report tab should look like this:
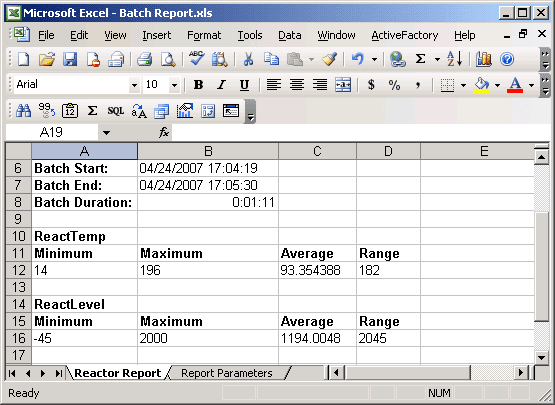
Part 6: History Values Table for the Batch1. Select cell A19 in the Reactor Report tab, then go to ActiveFactory menu -> Tag Values -> History Values to retrieve historical values for ReactTemp and ReactLevel for the duration of the batch. A 4-step wizard window will appear on the screen.
2. In Step 1 select cells containing both ReactLevel and ReactTemp (“Report Parameters”!$A$1:$A$2).
3. In Step 2 accept output cell as $A$19
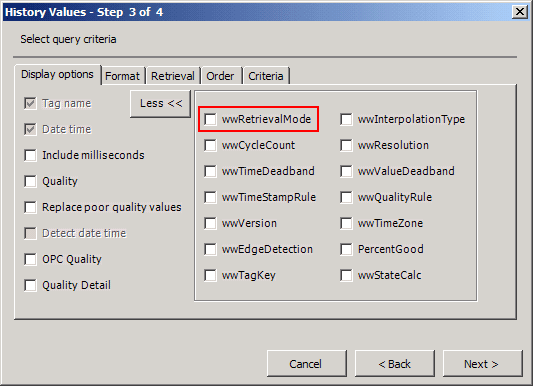
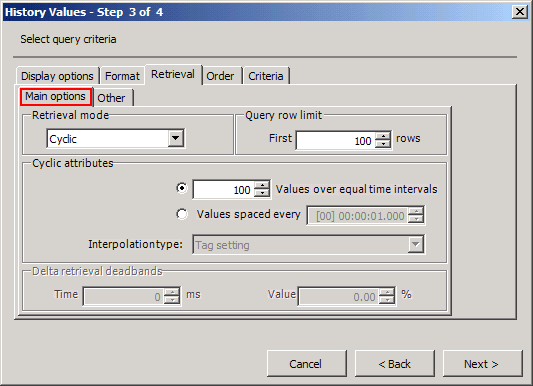
4. In Step 3 under Display Options tab uncheck Quality, under Resolution tab select Cyclic retrieval mode (assuming we want to retrieve 100 rows worth of data for the batch).
In ActiveFactory 9.2 uncheck wwRetrievalMode checkbox and go to Retrieval -> Main options tab to select Cyclic retrieval mode
5. Step 4 should show the same time options as set earlier. Results paste into the report after you click Finish. Result will be pasted into Reactor Report tab.
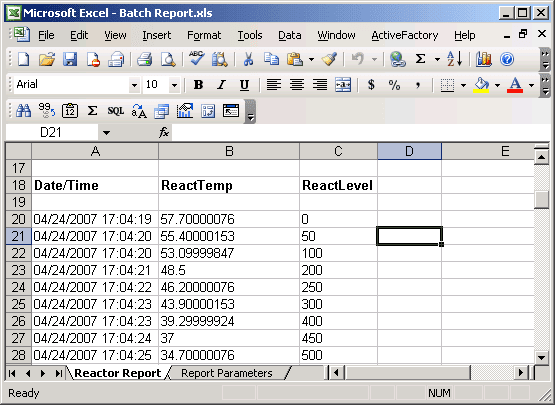
6. Using Excel features you may want to create charts based on the history or aggregate date (the screenshot shows a sample XY Scatter plot).
7. Type in batch number in cell B4 on the Reactor Report tab and observe the spreadsheet recalculate.
All Industrial Software Solutions Tech Notes are provided "as is" without warranty of any kind.