

How to monitor Wonderware Historian performance from Wonderware InTouch application
SUMMARY
This AVEVA Historian includes two features that allow performance statistics to be collected and distributed to network clients. The System Driver module performs the task of collecting Historian performance statistics and the Historian IOServer allows clients to connect via Suitelink to acquire real-time data. Using these two features we can acquire Historian performance statistics to clients such as InTouch for real-time monitoring and alarming.
APPLIES TO:
- Historian Server, all versions
- InTouch HMI, all versions
PROCEDURE
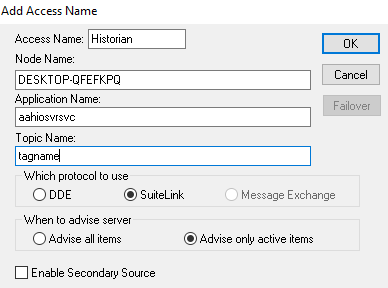
- First, we must know the node name or IP address of the Historian. In this example our Historian is called “DESKTOP-QFEFKPQ”. With this information we can configure an Access Name in InTouch to reference this data source. The configuration details vary depending on what version of Historian is being used. To create a new Access Name in InTouch, click on the Special drop-down menu and select Access Names. Click on the Add button.
- Once we have configured an Access Name to reference data from the Historian we can now configure tags in InTouch to monitor and alarm on specific performance statistics. In this example we will be monitoring the historian for “Fatal errors” which indicate a complete failure. To configure this tag, open the Tagname Dictionary and create a new I/O integer tag. Configure the tag as shown below:
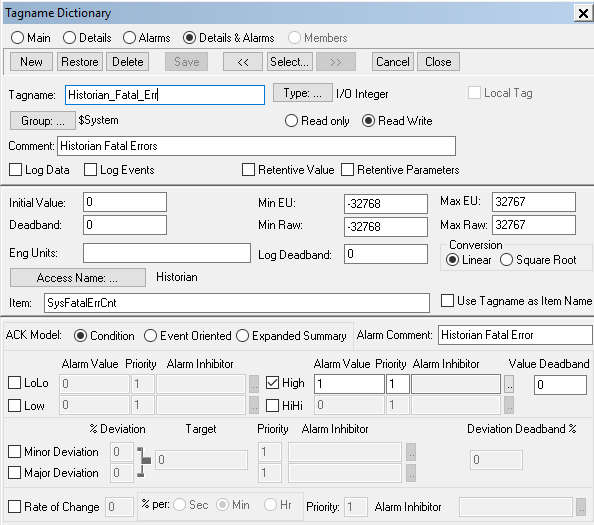
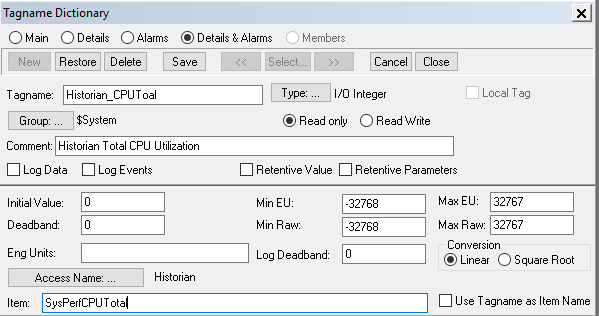
Save this tag, and it can now be used to monitor fatal errors in the Historian. Also, if any fatal errors occur, InTouch will alarm to notify operators that there has been a failure. Here is another example that will allow us to monitor real time processor utilization:
Below are some other important performance monitoring items that are available in Historian:
Error Count Tags
- SysCritErrCnt – number of critical errors
- SysErrErrCnt – number of non-fatal errors
Storage Space Tags
- SysSpaceMain – space left in the circular storage path
- SysSpaceAlt – space left in the alternate storage path
I/O Statistics Tags
- SysPerfDataAcq<N>CPU – CPU load for the specific IDAS denoted by <N>
- SysPerfRetrievalCPU – CPU load for the client retrieval subsystem
- SysPerfStorageCPU – CPU load for the storage subsystem
All Industrial Software Solutions Tech Notes are provided "as is" without warranty of any kind.