Oil and Gas: Unlock potential with real-time data
Written by Rishabh Singhal, Industry Marketing Manager, AVEVA
Over the past year, the oil and gas (O&G) industry has continued to thrive in a changing energy landscape. Recovering prices and free cash flows, record investments into green energy and fuels (5% of total O&G CAPEX according to IEA estimates), and an increasing adoption of digital tools have positioned the industry to succeed.
However, there is still a lot companies can do to increase production efficiency to meet demand and climate targets. O&G companies continue to operate in tough conditions, facing myriad challenges:
- Market volatility and commodity price fluctuations threaten already tight margins.
- Aging energy infrastructure.
- A generational shift to a newer workforce.
- Intensifying environmental and regulatory pressure as the energy transition accelerates.

To navigate these challenges, companies must invest in digital tools and look inward to drive operational efficiency. This means extracting every ounce of value from their operations across the entire value chain—from the individual asset and plant level to commercial and enterprise stakeholders. Operators must develop workflows that allow them to capture, process, and store huge amounts of time-series operational data and make use of it to develop models and fuel advanced analytics applications. The next critical step is to securely share this data to be shared with teams from across the asset and commercial life cycle, enabling better decision-making at all levels.
The data tsunami
Oil and gas operations—and energy sector at large—are facing a massive data tsunami. The O&G industry is no stranger to advanced technologies, and has been at the forefront of analytics across all facets of the industry, from production to transportation to processing and distribution. IBM estimates that the average offshore production facility receives more than 80,000 data streams coming from IIOT sensors, PLC systems, DCS, and other control systems, which can generate petabytes of data over a facility’s life.
Processing and making use of this much data can be daunting. Even operators who have data management systems in place struggle to realize the full value of their information. An effective information management structure can equip companies to gather, analyze, and share data to unlock insights that accelerate profit-boosting strategies.
Three core pillars of operational efficiency
The question then becomes: How can operations teams manage this flow of operational data and develop internal systems to drive operational efficiency? They can do so by focusing on three core pillars:
Maximizing workers’ situational awareness
As operations become increasingly complex and the margin of error becomes slimmer, workers in the field and in the office need real-time data to make better decisions quickly. O&G companies must implement effective human-machine interface (HMI), cloud, and mobile technologies so that teams become more agile and informed. Informed workers can then work towards real-time optimization of plant or facility operations, potentially to the tune of tens of millions of dollars.
Developing data management infrastructure
Developing an IT infrastructure to manage the volume of data generated by O&G operations is a critical priority. As operations become more complex in unconventionals and drilling margins become tighter in marginal fields, data volumes are growing into terabytes of time-series data. While the O&G industry has traditionally turned to data historians, operators can further benefit from tools that allow then to create and customize operational data models that can be enhanced with metadata, additional structuring, and real-time analysis. This can save hours of tedious duplication efforts and measurably increase data accuracy.
Contextualizing data with centralized visualization
Data alone is not enough. For it to be valuable, information should help drive better decision-making when it is most needed. Operators must develop tools that allow individuals and teams to share information across the organization. Effective visualization tools not only share data streams, but also aggregate from numerous data sources, painting a holistic and accurate representation of operating assets.
Tools that can integrate engineering, finance, and third-party data (weather APIs, seismic and geospatial data, CMMS data, etc.) with operational information to provide an end-to-end visualization of the value chain deliver the most value to companies. Because centralized visualization tools must be maintained to optimize speed and performance, ease of use and system performance are critical.
Proven operational efficiency solutions from AVEVA
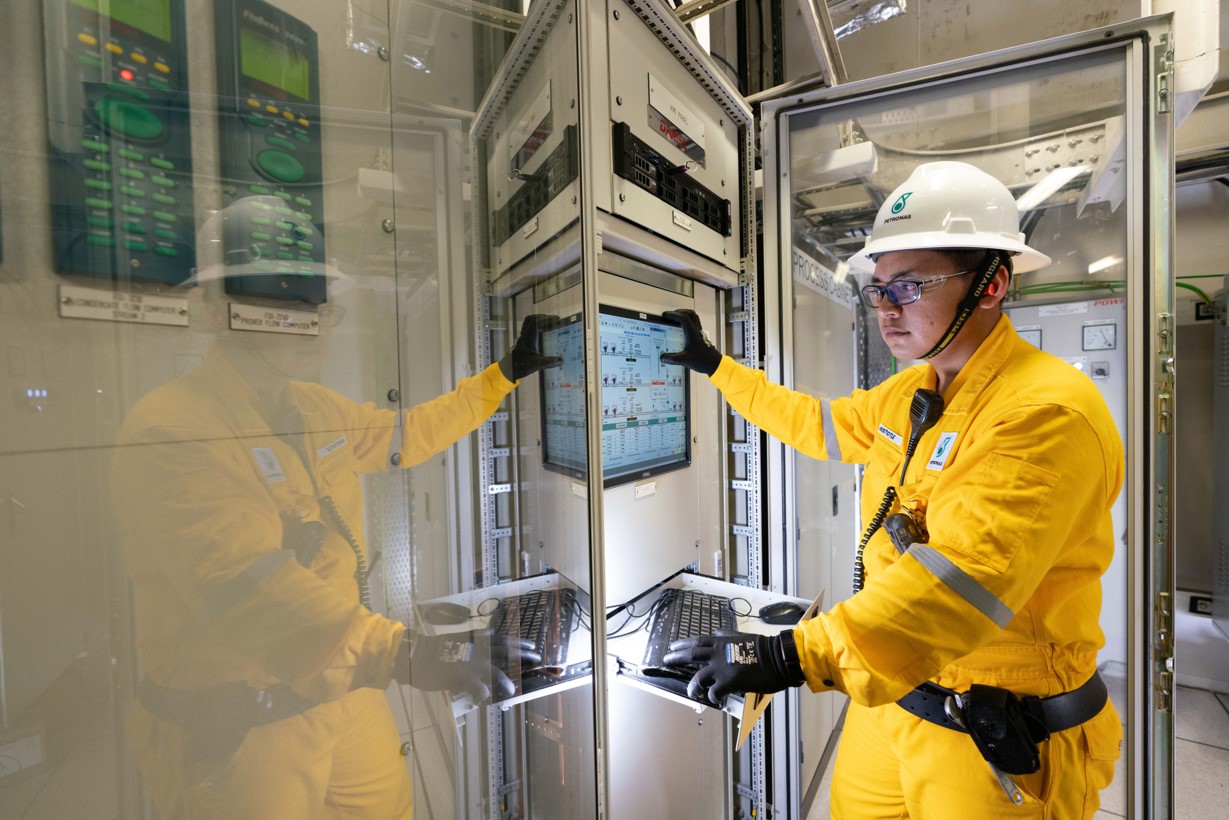
Major operators have already trusted AVEVA solutions to drive operational efficiency. Petronas, Malaysia’s national oil company (NOC), uses AVEVA™ PI System™ and AVEVA™ Unified Operations Center (UOC) to deliver 17 visualizations for their management team, allowing them to make better decisions with full visibility. These visualizations aggregate the more than five billion data points generated every day.
Schlumberger, the largest oilfield services (OFS) company in the world, uses AVEVA Unified Operations Center to aggregate 100+ data sources in real time to deliver full visibility to workers through a web-native client. This system has already led to a 20% improvement in equipment turnaround time and 10% extensions in mean time between maintenance, with greater value anticipated.
More than 75% of global, daily oil and gas production, transportation and processing is facilitated by AVEVA solutions, and it will continue to pave the way for operational efficiency for the largest O&G operators in the world.