

Insight Update – Drive operational continuity and efficiency
Satellite view for maps
Previously released on mobile, we have now added to the browser experience the ability to easily switch between street view and satellite views, providing additional context for remote assets.
Plus, if you save a map to your content library, then the current mode (street view or satellite) is also included as part of the save so you are automatically returned to the same view on future access.
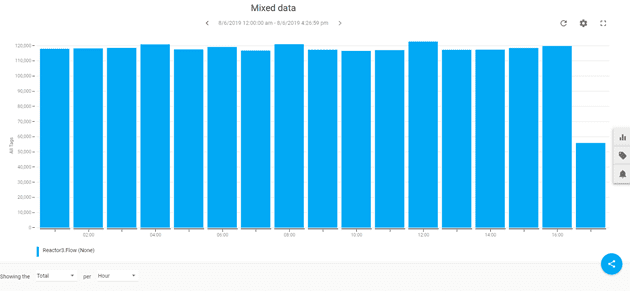
Additional calculation options on charts
We’ve also made improvements to the available calculations that you can perform on charts. The “Rolling Sum” chart has calculated a rolling total from a periodic average, which works well for measurements that represent a quantity, such as “cubic meters”. However, in cases where the measurement represents a rate, such as “cubic meters/hour”, the appropriate value to total is the daily total volume – get this by selecting the “Total” statistic that is now available on the chart.
Suspend or activate alerts
Building on from the more advanced alerting released in May 2019, users can now suspend an alert so that notifications are not sent. Simply select Suspend on the drop-down menu of an Alert on the Alerts page. Then when you’re ready to start receiving alerts again it is as simple as selecting Activate.
Enhancements to the Equipment Monitoring capability
Just like Reason Groups we have also added Equipment Groups to the Equipment Efficiency page. This means that related equipment can now be grouped together, for example “Production Line 1” or “Area A Case Packers”. Grouping equipment together can give users a simpler and faster method of managing large numbers of equipment.
In the example below, users can now quickly switch between All Equipment and Houston Line 2 via the drop down menu.
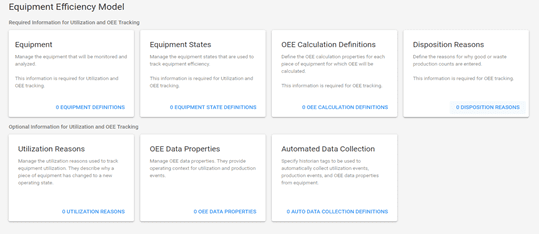
Efficiency model configuration improvements
The efficiency modeling experience has been reorganized into multiple cards to make it easier to understand which options can and need to be configured to support the Utilization and OEE tracking capabilities within Insight. The same bulk import and editing capabilities are still available in the new modeling experience.
We have improved the ability to maintain existing efficiency model data within Insight. Now, an Administrator can perform an export of all efficiency model elements (e.g. equipment definition, equipment states, utilization reasons, etc.) to a CSV file. Allowing them to easily execute bulk edits and updates via Excel.
This new feature is also helpful when moving or transferring efficiency models from one Insight solution to another.
Data source improvements
We’ve added to other data sources the ability to import a CSV of data just like you may have done in the past with a CSV/JSON data source. This can act as a solution for correcting missing or erroneous data, as well as providing basic backfill functionality for history that may be contained in another system. To backfill this missing data, Administrators can simply upload the CSV/JSON file to your existing data source.
In addition to the existing “wide” format CSV we have added support for a new “narrow” CSV format. Narrow CSV can open more options for device compatibility, as well as reducing bandwidth for custom integrations that use CSV as a data solution. Refer to the Help file for more: https://insight.connect.aveva.com/help/#634485.htm
Try Insight for yourself – see how it works, looks and how it could benefit your organization today. No server infrastructure required.