Insight Update – Alert Management & Production Context
Simplified alert management
Since introducing multi-tag alerting to AVEVA Insight in May, AVEVA has continued to evolve their cloud-based condition management capabilities. This month they have made it even easier to view and manage alerts.
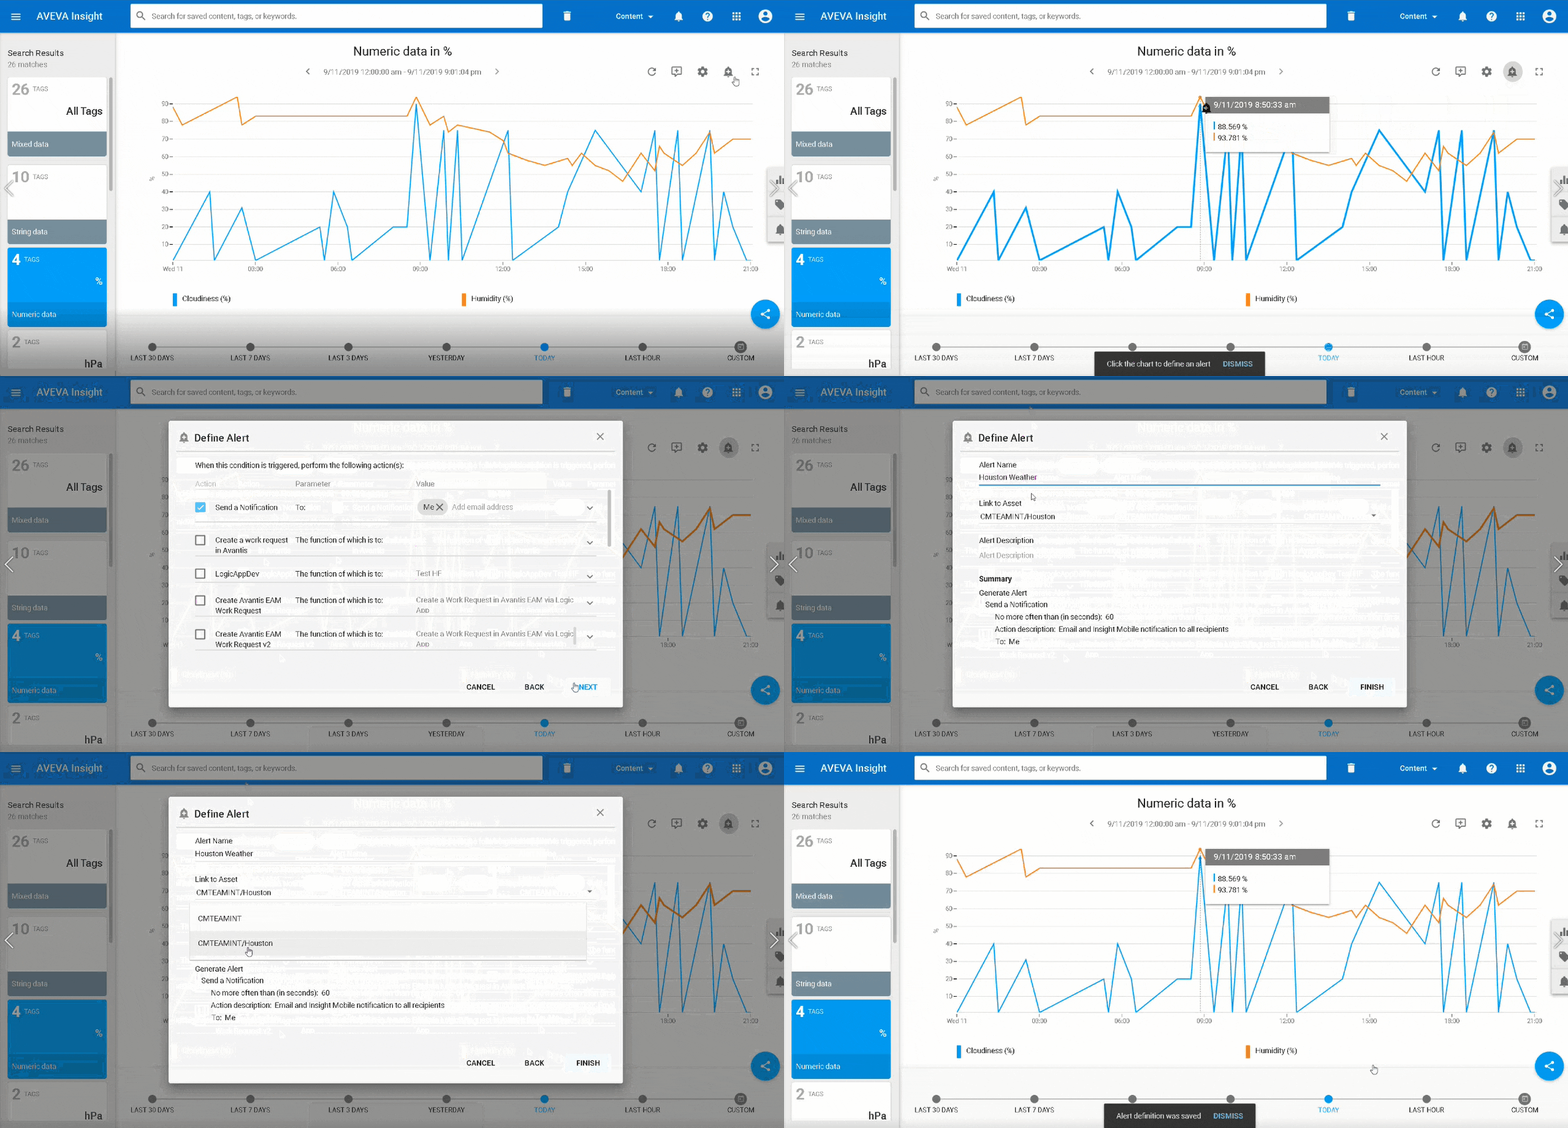
Quickly associate an alert with any asset, or location, you have specified within the system. Your alerts are now grouped together effortlessly so it is much simpler to view and manage them.
As you can see, the ‘Link to Asset’ field will be auto-populated based on the tags selected for the alert . While this default works most of the time, the ‘Link to Asset’ field is configurable, so you can choose to associate alerts to the assets where they make most sense.
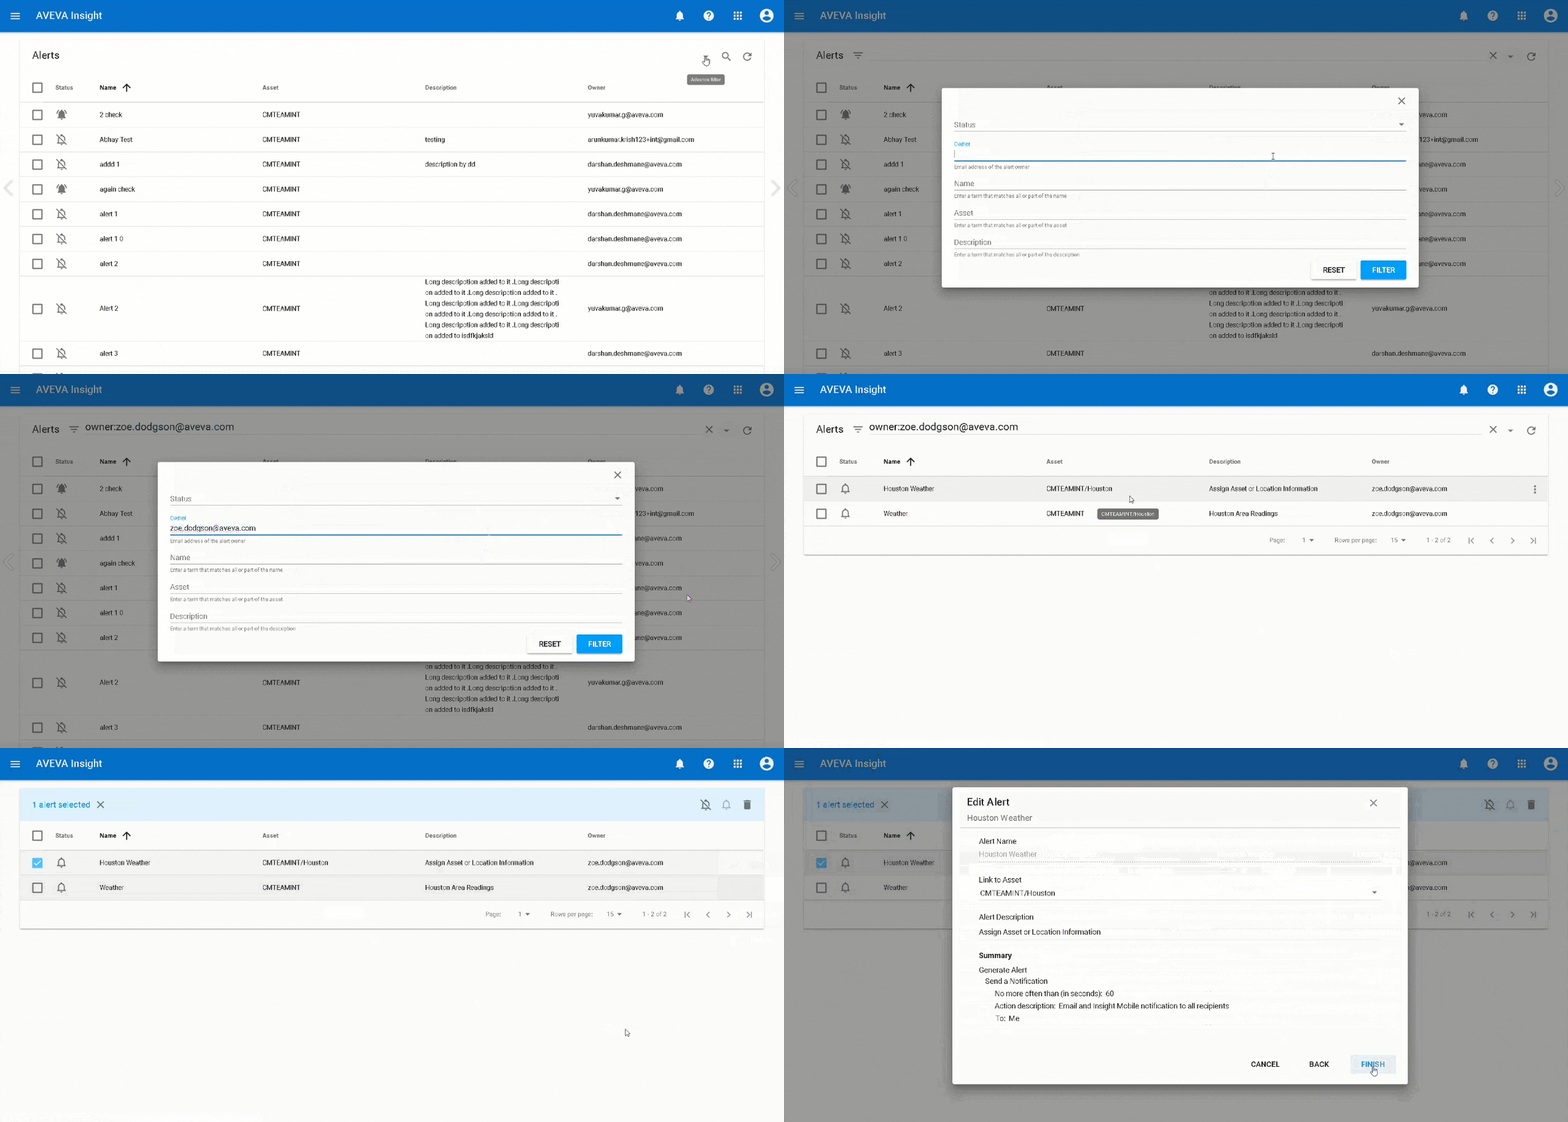
When viewing on the alerts page, you’ll notice that the Asset column shows the asset to which each alert is linked. You can now also filter by column, which makes it much easier to find and modify alerts – particularly as your system becomes larger. The filters can be applied across all the field shown on the alerts page, applied in real time, to help you find what you need more quickly.
Finally, solution administrators can now manage the alerts configured within the solution, irrespective of who created them. Allowing both the administrator, and the original creator, to configure the alerts provides simpler management and a more sustainable solution as organizations evolve. No more late-night notifications because Bob didn’t disable those alerts before he retired!
Additional production context
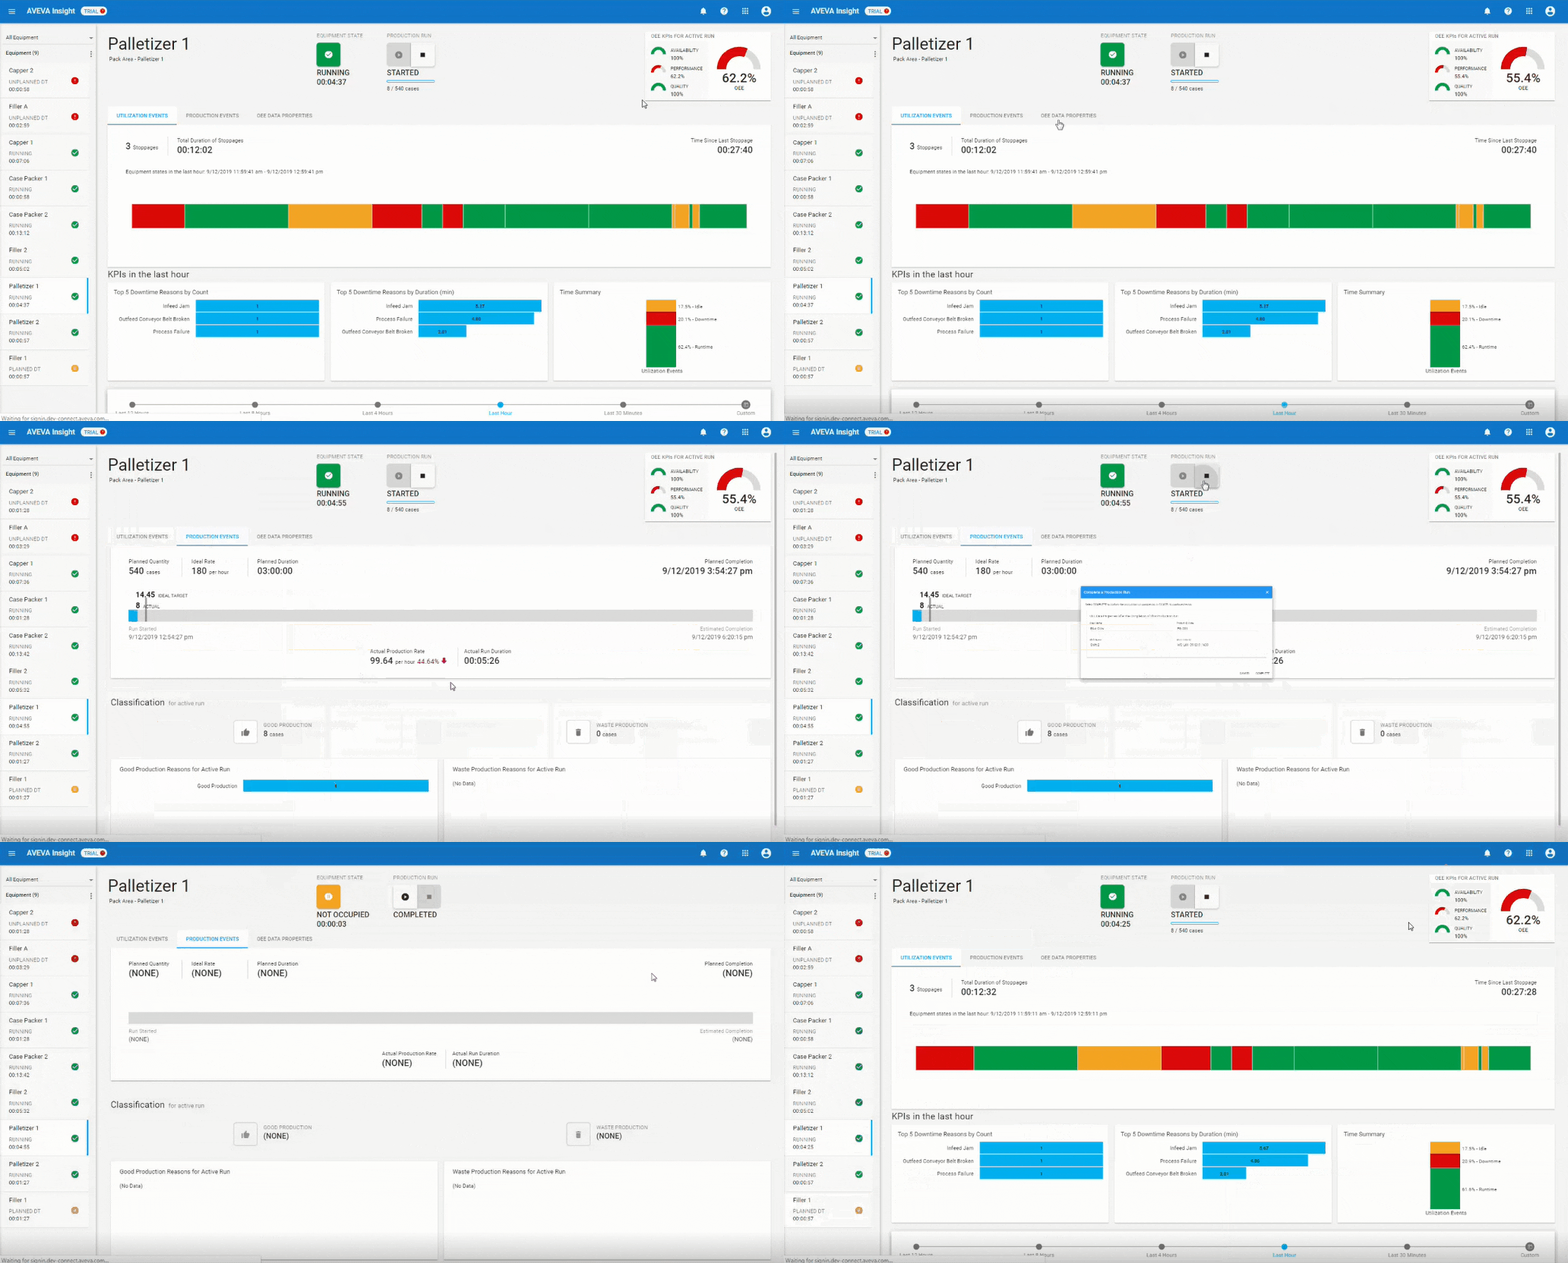
For the Insight operational user, we’ve made improvements that provide additional context around production data. For instance, the OEE KPIs at the top right-hand side of the Equipment Efficiency page now clearly indicate that the KPIs are for the current production run. We’ve also added the actual production rate for the active production run on the Production events interface. Each of these shows values while the production run is active and is removed once complete – thus helping to avoid any potential confusion.
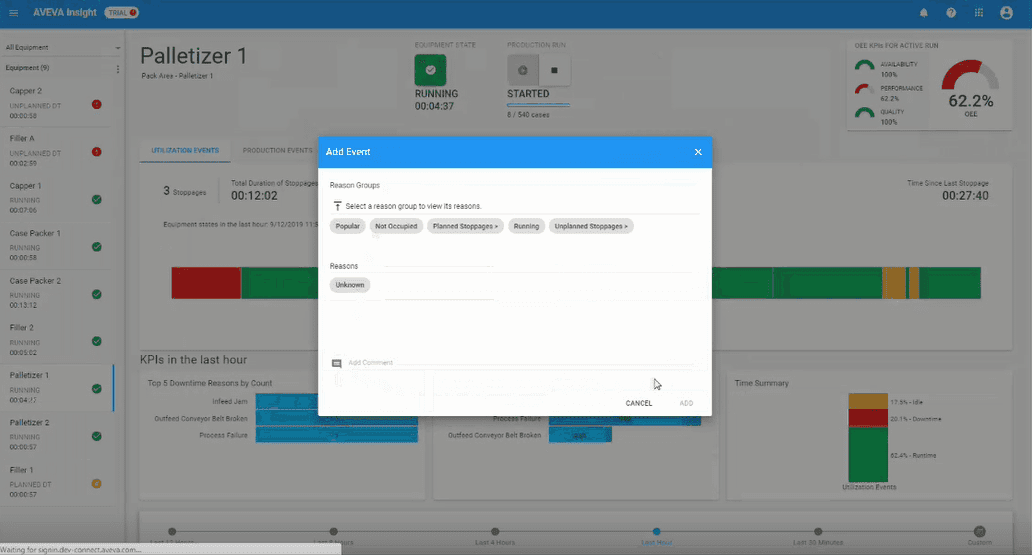
For utilization events, the length of the comment field has now been extended. This means you can capture all the critical details and information you need for future context and analysis.
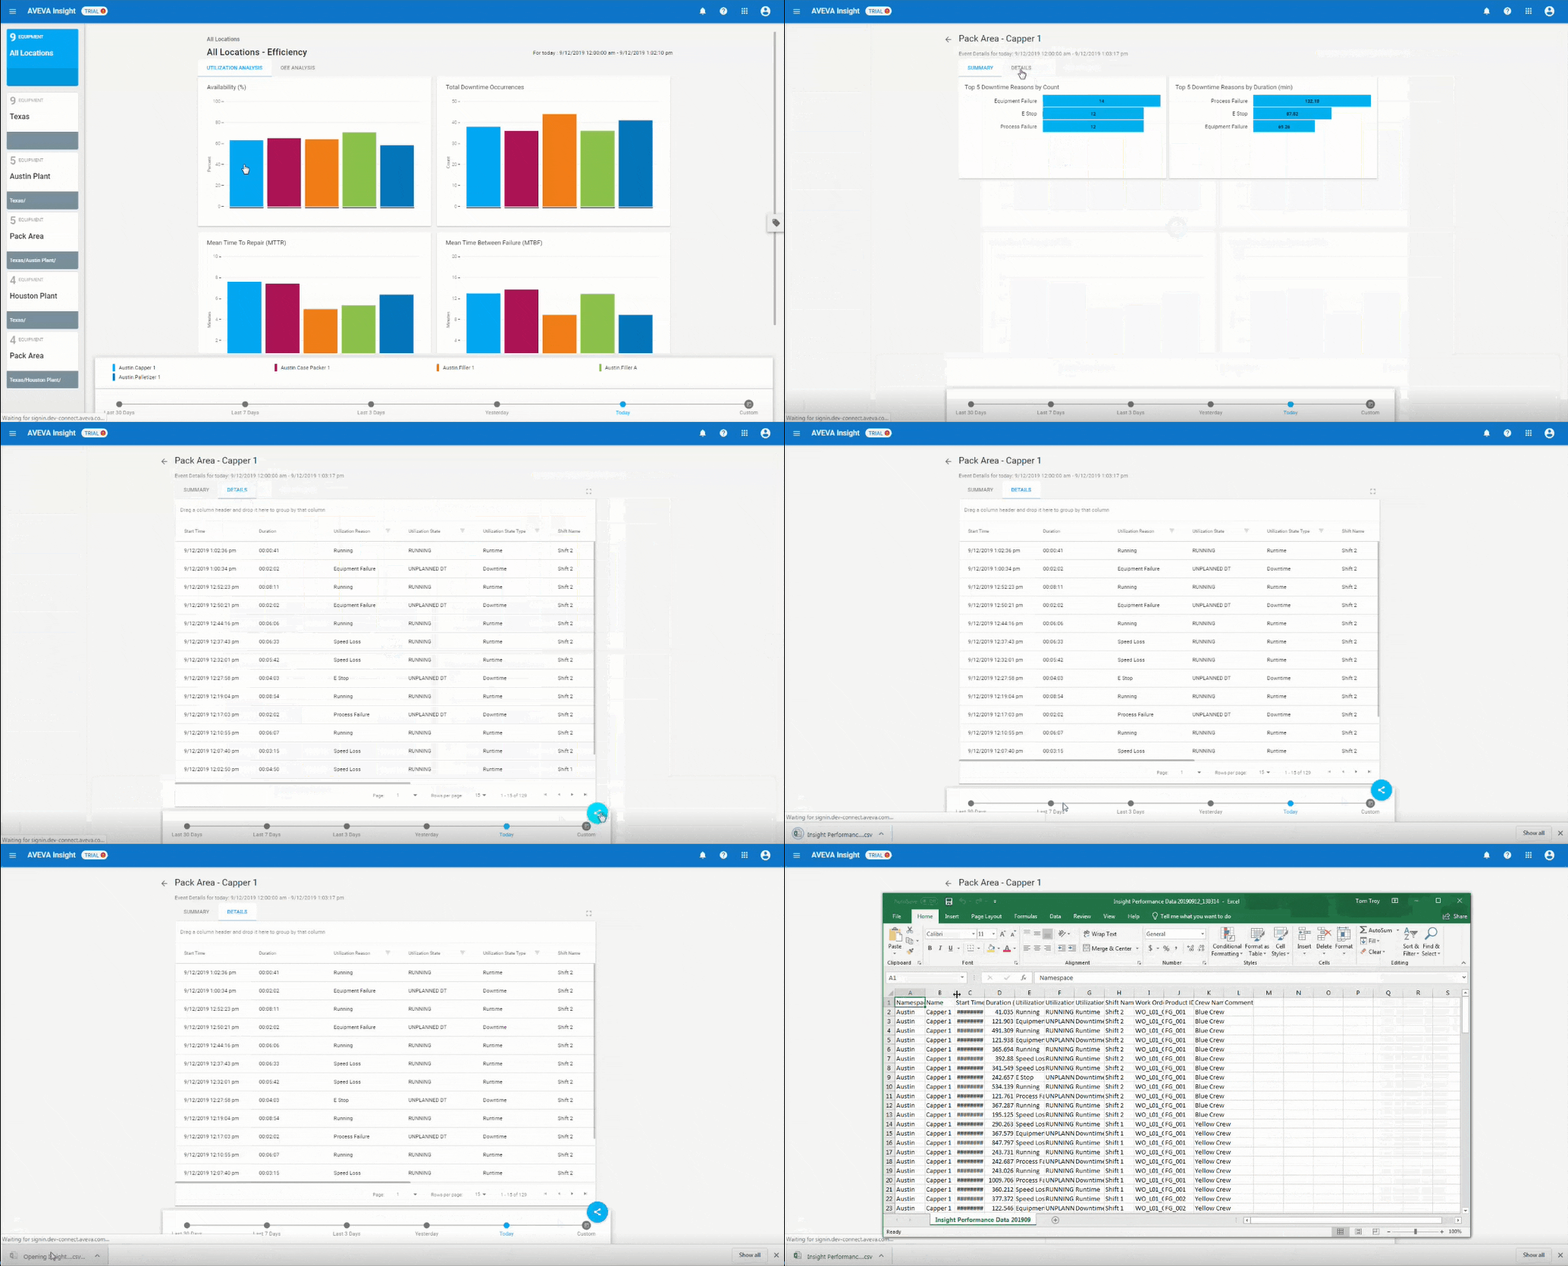
For more detailed analysis, we also improved how data is exported from the OEE Analysis page. Now, the CSV download will automatically include the equipment name column so that all the relevant information is captured in one place for faster analysis.
Usability improvements for visualization
AVEVA also updated the visualization capabilities to provide additional context to all users. For example, when plotting tags on maps, you can now add the current state value next to the historic values. This gives you at-a-glance understanding of what is happening, and what has happened, in your operations.
And, to make it easier for operators to quickly assess current states on any chart type, analog graphics now format based on the number size e.g.
- if the Value, Min, or Max is between 0 and 1, four decimal locations are shown.
- if the number is between 1 and 9,999, two decimal places are shown.
- if the value is 10,000 or larger, no decimal places are shown.
Try Insight for yourself – see how it works, looks and how it could benefit your organization today. No server infrastructure required.