

Enterprise visualization and where it fits within operations technology
Written by Jeremy Wilbert, Sr. Product Marketing Manager, AVEVA
Human machine interfaces (HMI) have been the go-to visualization for operations technology and industrial automation for decades. At the start, HMIs were primarily a means to digitally enhance and transform control capabilities. Eventually, the use of HMIs expanded to encompass supervisory control and data acquisition (SCADA) applications, allowing users to access information aggregated by many HMIs and connected equipment—all from a control room far removed from the actual process. Now we are experiencing another significant shift as the quantity of data sources and diversification of where that data is consumed expands again.
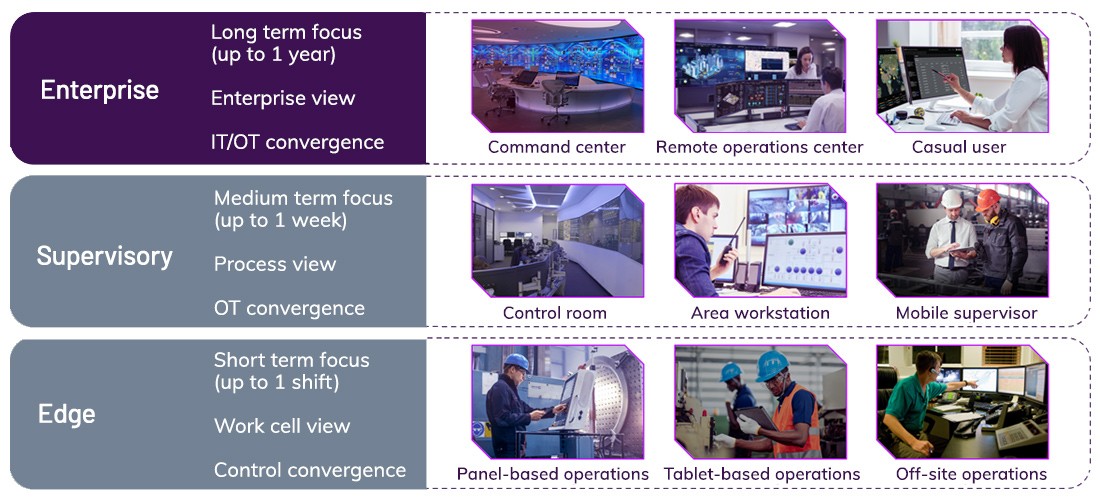
Enterprise applications that focus on the broad scope of large and complex operations are not new. However, those applications have generally been more transactional and processed more traditional business information at a slower pace. Now, by leveraging new advances in communication technology, databases, and smart devices, visualization tools are powerful enough to support real-time decision-making. In addition to HMI-type visualization, which is accessed at the edge, near the process, and supervisory visualization, which offers a point of operational convergence, there’s also enterprise visualization, which blends information technology (IT) and operations technology (OT) data sources into one unified, and graphically focused application.

This new solution offers a diverse set of capabilities, separated from the control side of operations, intended to drive efficiency, agility, and reliability across the entire industrial operation. Roles that support supply chain performance, operational responsiveness, and process resolution will benefit from this new perspective and the combination of deep data and contextual insights.
How is enterprise visualization different than supervisory visualization?
The concepts and data behind supervisory visualization and enterprise visualization can be quite similar. Asset models, KPIs, graphics, and screen layouts used in supervisory applications benefit users with added context, and they also relay process insights that enterprise users may find valuable, depending on their role and responsibilities. However, the key goal of supervisory visualization is the targeted control of a process—activating equipment, shutting valves, or other actions that have real, physical implications and must account for safety and process-specific intent. Enterprise visualization focuses more on the management and aggregation of information from various sources to make decisions that are beyond the scope and visibility of teams operating near the process.
These distinctions can be further broken down into different types of operations centers between supervisory and enterprise visualization based on functional use. This means that the more focused an application is to the precise process, equipment, variability, and operation of these aspects, the more aligned it is to the functional discipline. Applications with a broader view become cross-functional and look at the wider value chain performance and implications on the business.
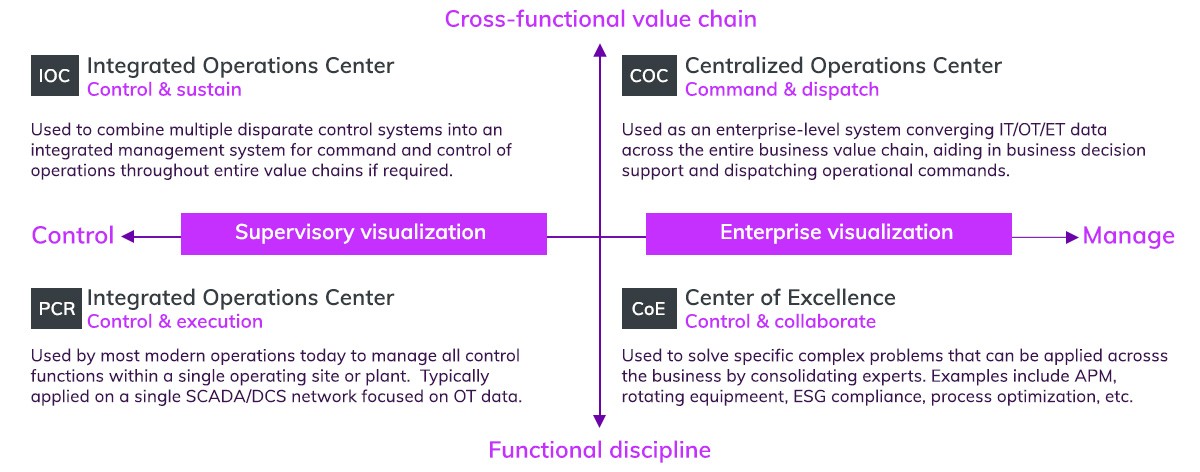
Our experience in deploying these solutions for customers has typically aligned to four types of operations centers. Each serves a specific purpose for the business, and, in most cases, uses the same underlying operations data, only aggregated and contextualized in different ways.
On the supervisory side, we have process control rooms, which focus on the direct control and execution of a process, and Integrated operations centers, which coordinate the activities and sustainability of process operations across multiple segments or sites. For enterprise visualization, we have centers of excellence, which group experts together to solve specific challenges at individual sites through higher-level visibility and collaboration. Centralized operation centers offer the broad perspective you need to navigate challenges that affect the entire business.
Of course, this model doesn’t account for every use case. The outcomes, perspectives, and information you use to get there will influence how you implement these systems. Another aspect to consider is that, although these are often depicted as rigid, physical locations, they are essentially software applications that can be utilized in any way that makes sense for the users of these systems, whether video wall, desktop, mobile, or other configuration. This flexibility helps to explain the gradual expansion of users we’re seeing—from highly structured facilities to individual business and casual users—that are now seeking insights from a single operations visualization environment.